
 Canada (English)
 Colombia
 Caribbean and Puerto Rico
 Ecuador
 India
India
 Indonesia
 Ireland
 Malaysia
 Mexico
 Panama
 Peru
Peru
 Philippines
 Singapore
 South Africa
 Sri Lanka
 Thailand
 United Kingdom
 United States
 AcumatiCares


The AR turnover ratio helps finance leaders understand how efficiently a company collects outstanding payments and converts credit sales into cash. However, knowing what the ratio measures and being able to use it consistently and in the right context are two different things, separating finance teams who often react to issues from those who spot problems early and act decisively. A single number, read without context, can mislead. Paired with aging reports, payment trend data, and a clear view of your customer base, it becomes a genuinely useful signal.
This guide walks through the standard AR turnover formula, interpretation frameworks, industry benchmarks, and process improvements that help small and mid-market finance teams move from periodic calculations to ongoing visibility.
Note: The AR turnover analysis, benchmark interpretation, credit policy, and reporting practices discussed here are intended to support, not replace, professional accounting, financial, tax, and credit-risk guidance. Every organization’s situation differs based on industry, payment terms, internal controls, and reporting needs. Consult qualified professionals before making changes to credit policy or financial processes, particularly in multi-entity, multi-currency, or complex-customer environments.
What Finance Leaders Should Know About the AR Turnover Ratio
Because the AR turnover ratio is an asset efficiency metric, a higher ratio generally suggests that customers are paying on time and that collections processes are working well. A lower ratio can point to delayed payments, lenient credit terms, billing friction, or unresolved invoice disputes.
The relationship is not entirely one-directional, however. An unusually high ratio may also reflect overly restrictive credit policies that limit sales opportunities, pushing customers toward competitors who offer more flexible terms. For finance leaders, the metric connects directly to the concerns that matter most: cash predictability, liquidity management, credit risk exposure, and the ability to plan for growth without being caught short by slow-paying accounts.
Tracking the AR turnover ratio over time, rather than evaluating it as a one-time snapshot, gives the clearest picture of where receivables performance is heading.
How to Find AR Turnover Using the Standard Formula
The AR turnover formula divides net credit sales by average accounts receivable for the period being measured. The formulas are as follows:
Net Credit Sales = Total Credit Sales – Returns and Allowances
Average Accounts Receivable = (Beginning Accounts Receivable + Ending Accounts Receivable) ÷ 2
AR Turnover Ratio = Net Credit Sales ÷ Average Accounts Receivable
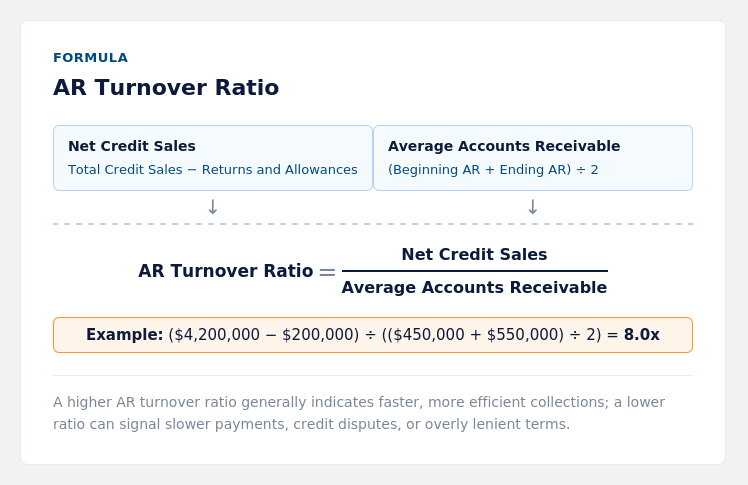
Cash sales should generally be excluded from the calculation because they do not create receivables and would inflate the ratio in a way that distorts the picture of collection efficiency. Here is how the calculation works in practice:
AR Turnover Ratio Example
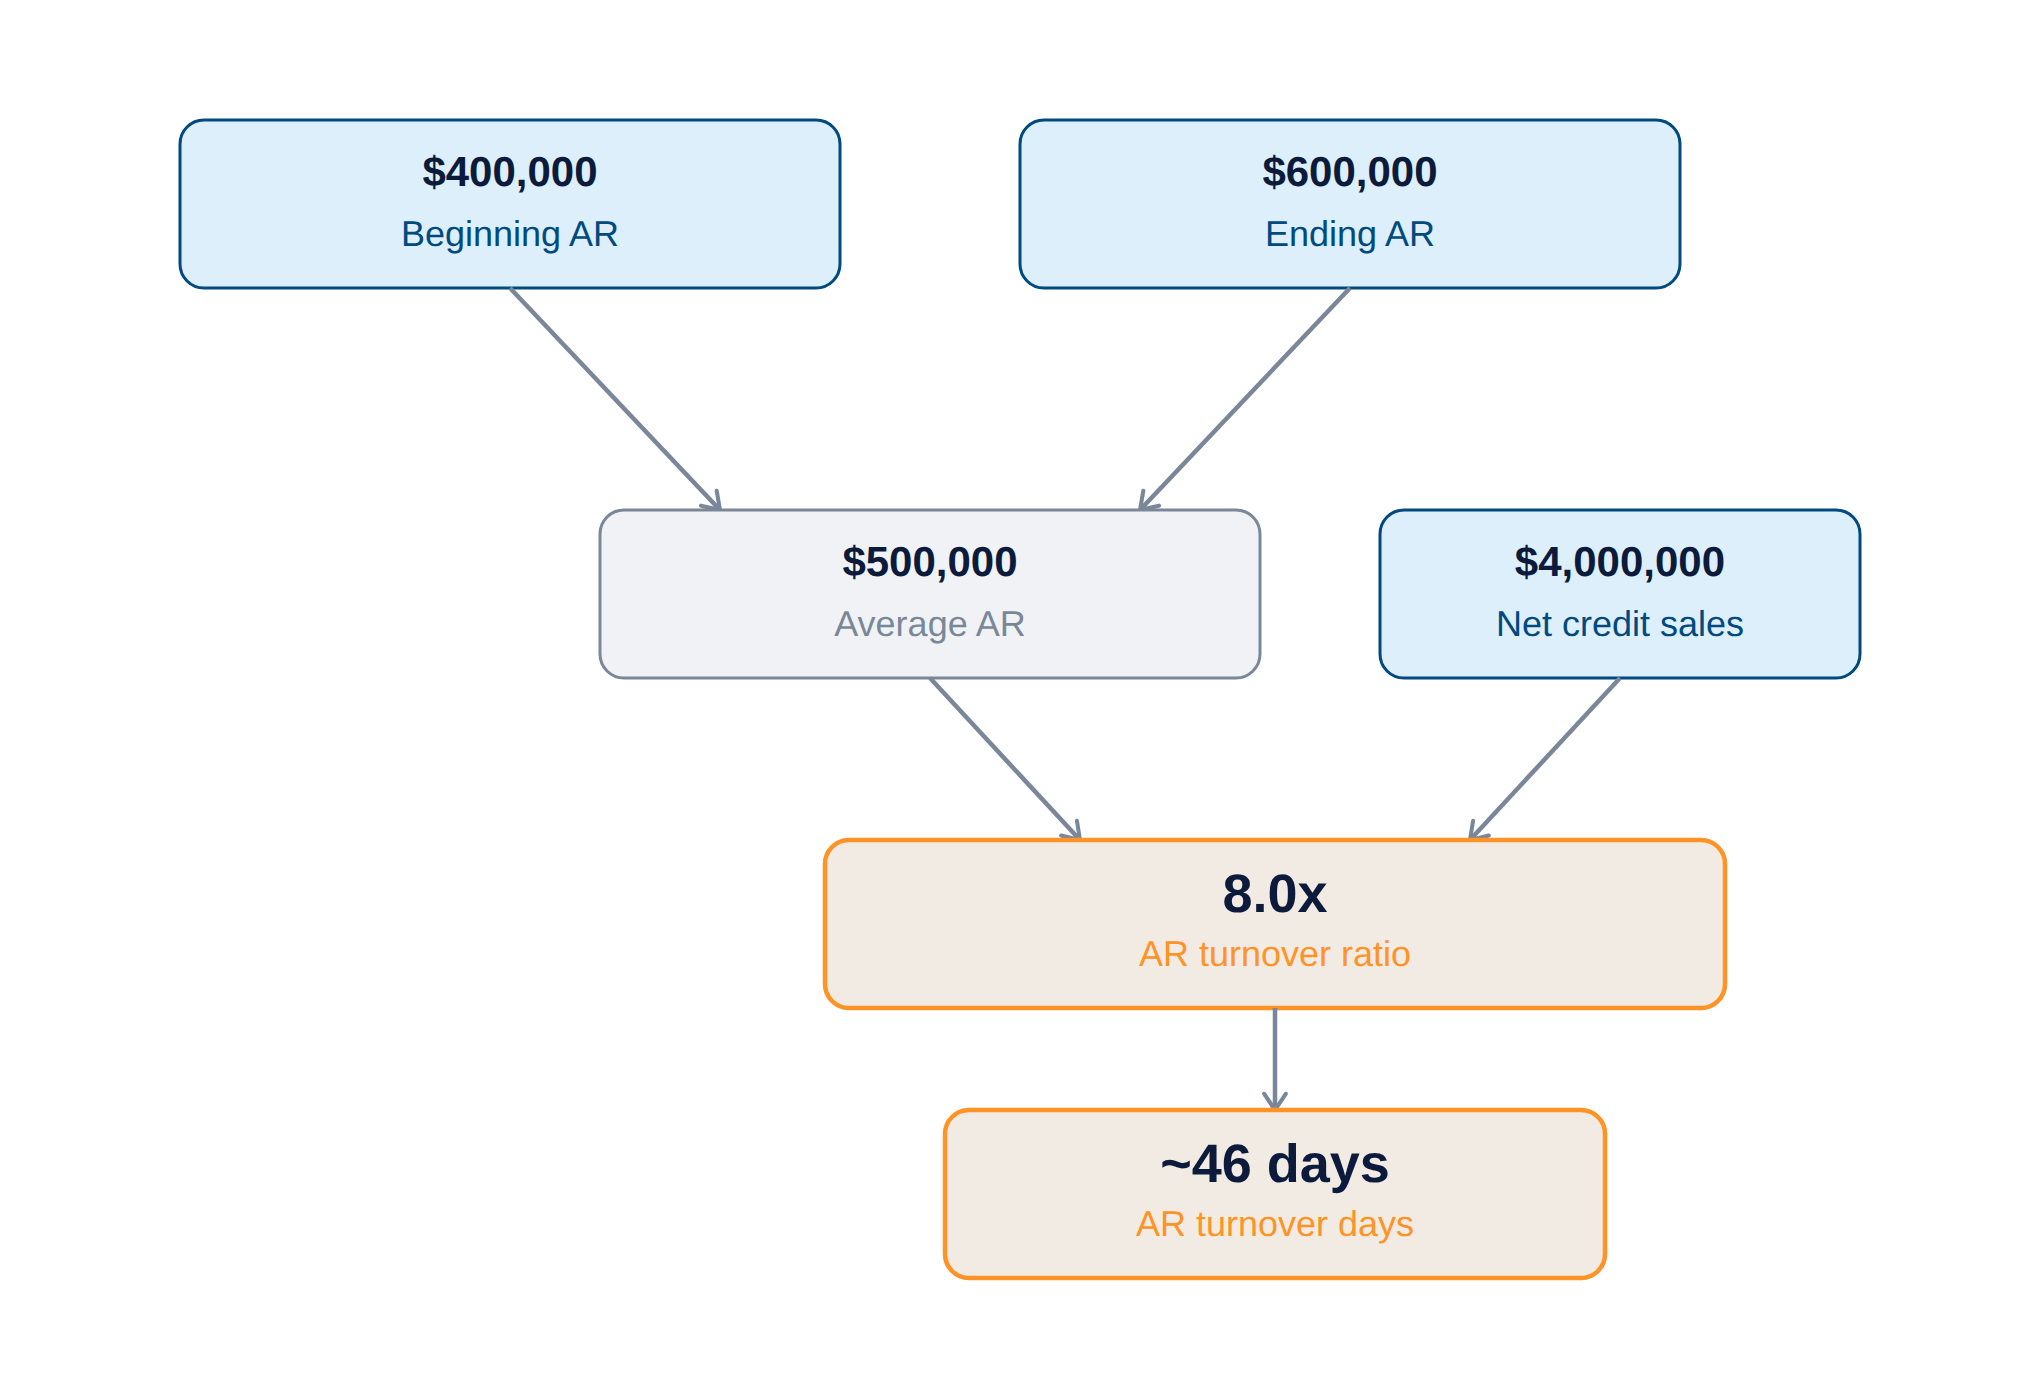
In this example, the company collects its average receivables balance roughly eight times per year, which translates to an average collection period of approximately 46 days. Whether that result indicates efficient collections depends on the company’s stated payment terms, historical performance, billing practices, and customer payment patterns. If the company offers net-30 terms, an average collection period of 46 days identifies a gap worth investigating. If it offers net-60 terms, the same result may be consistent with expectations.
How AR Turnover Days and Days Sales Outstanding Add Useful Context
AR turnover days converts the AR turnover ratio into the average number of days receivables remain outstanding, giving finance teams a figure that is easier to compare against actual payment terms. The formula is straightforward:
AR Turnover Days = 365 ÷ AR Turnover Ratio
AR turnover and days sales outstanding express collection performance in different ways. The AR turnover ratio shows how many times a company collects its average receivables balance during a period, while DSO expresses the collection cycle in days. When both calculations use the same sales, receivables, and reporting-period data, they provide closely related views of collection performance.
For an annual AR turnover ratio, divide 365 by the ratio to calculate the approximate collection period. For shorter reporting periods, finance teams should use the number of days in the period or annualize the ratio consistently. A company with an annual AR turnover ratio of 8 has an approximate collection period of 46 days.
Comparing AR turnover days against your stated payment terms, whether net 30, net 45, or net 60, is one of the most practical ways to determine if collections are running ahead of, behind, or in line with what customers have agreed to pay.
How to Evaluate Whether Your AR Turnover Ratio Is Healthy
There is no universal accounts receivable turnover ratio that indicates strong performance for every business. Appropriate results depend on payment terms, billing practices, customer mix, seasonality, contract structure, and the timing of credit sales.
Start by comparing the average collection period with the payment terms offered to customers. An annual AR turnover ratio can be converted into approximate collection days by dividing 365 by the ratio. A company with an AR turnover ratio of 8, for example, collects its average receivables balance approximately every 46 days. If most customers receive net-30 terms, that difference may indicate late payments, invoice disputes, or inconsistent collection follow-up.
Next, compare the ratio with the company’s own results from previous months, quarters, or years. A stable or rising ratio may indicate consistent or improving collections. A falling ratio may show that receivables are increasing faster than credit sales, even if the current result does not appear problematic on its own.
Industry characteristics still provide useful context, but they should not be treated as universal numerical targets. Construction companies may experience longer collection cycles because of progress billing, retainage, and change orders. Manufacturers and distributors may extend different terms based on customer relationships, order volume, or supply agreements. Professional services firms may bill by milestone, project phase, or time and materials. These operating differences help explain the result, but the most useful comparison remains the company’s actual payment terms and historical performance.
How Payment Terms Compare with AR Turnover
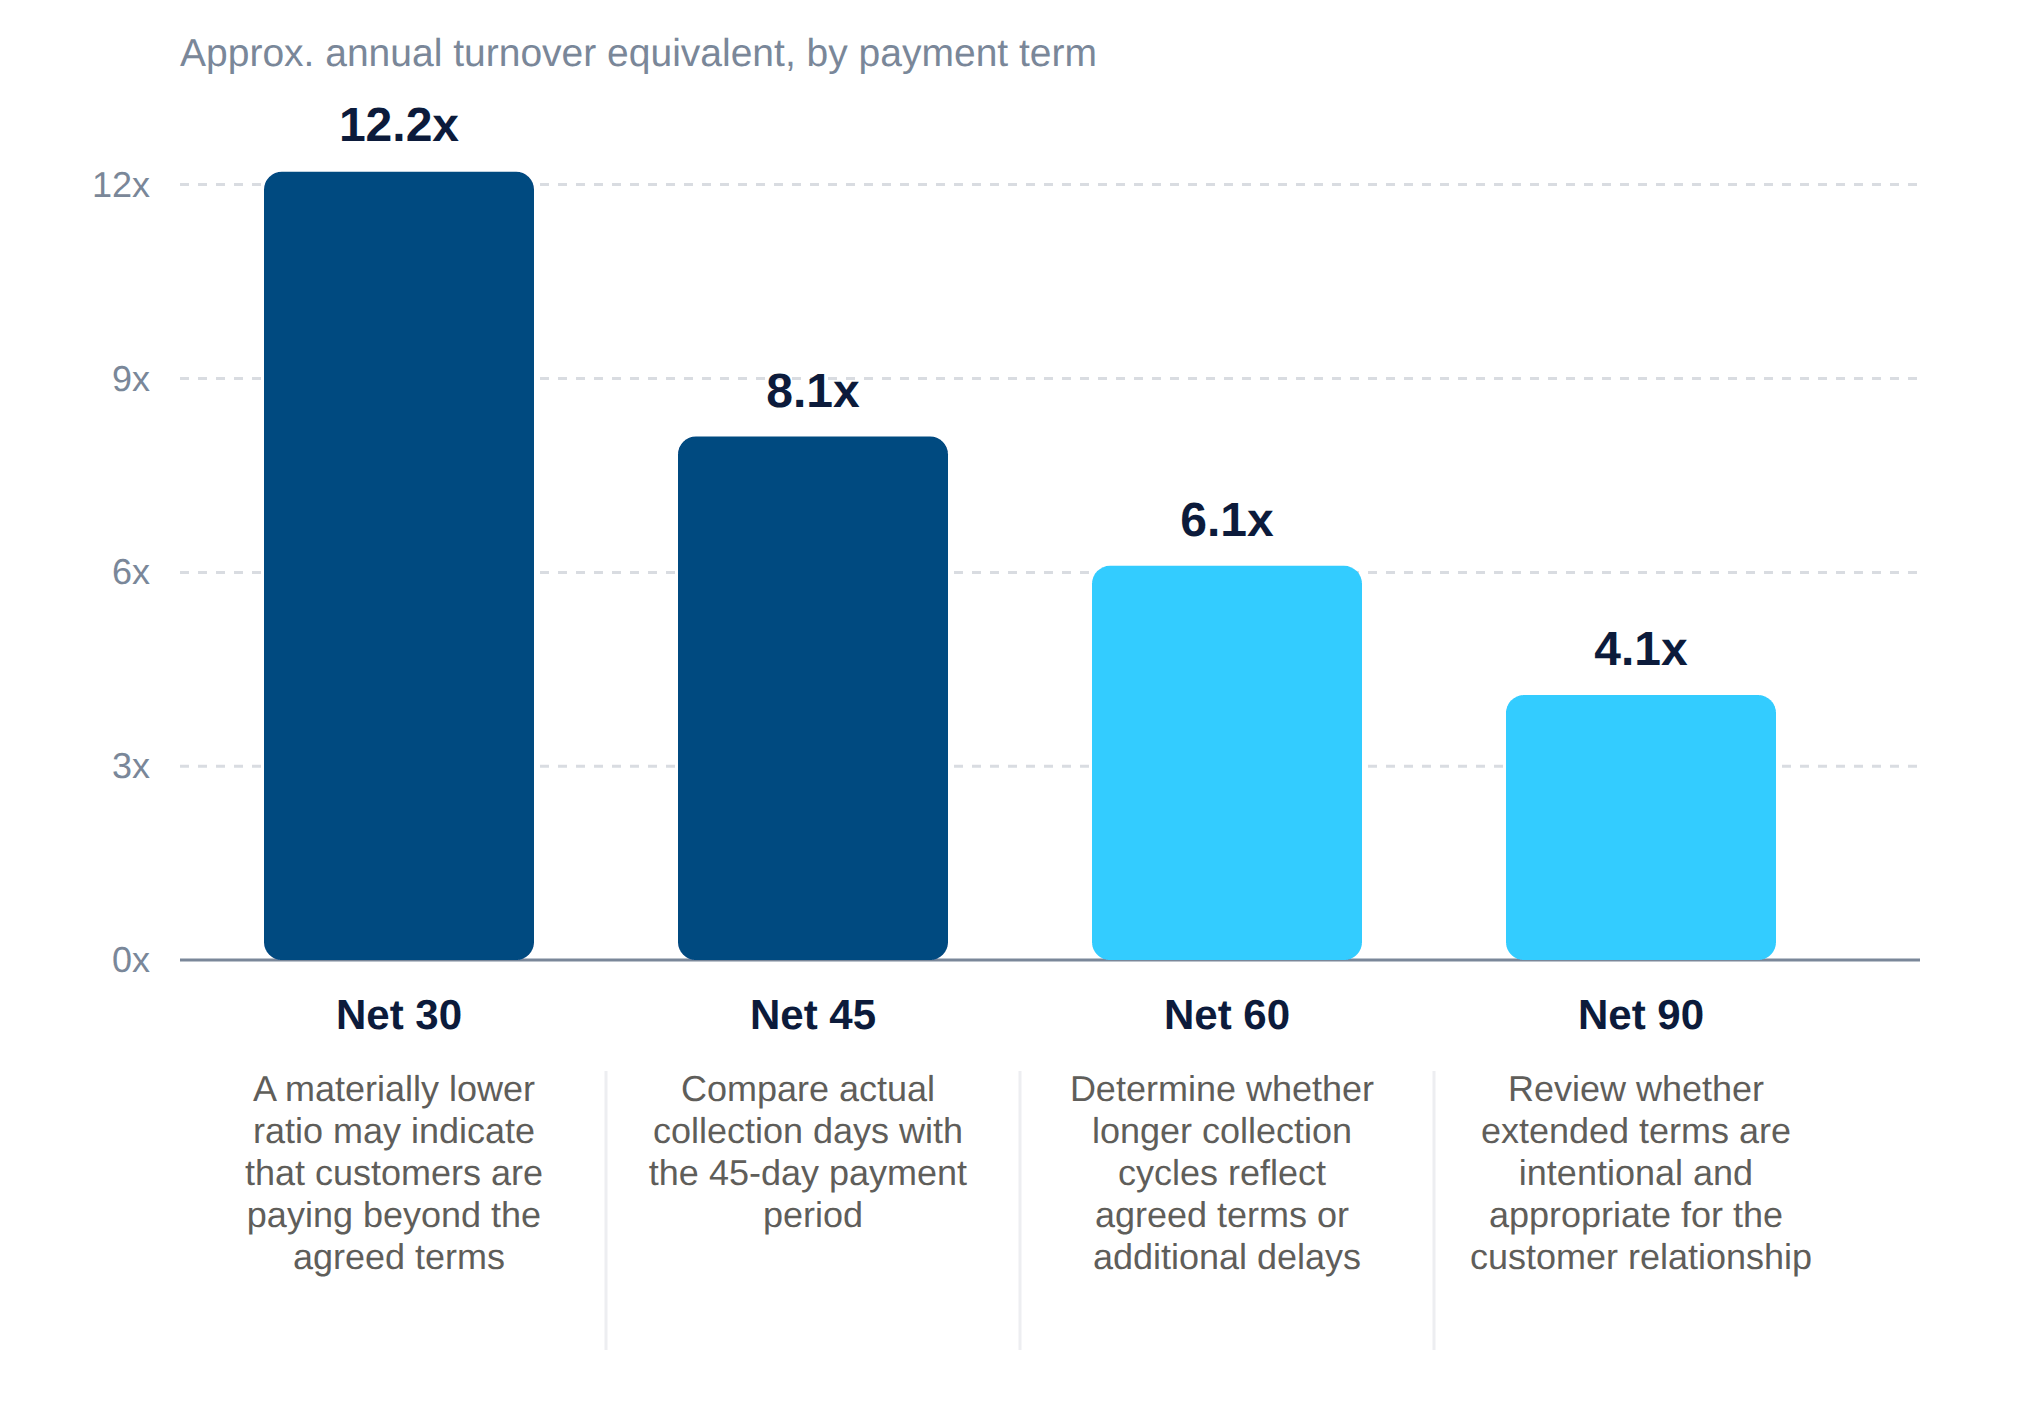
These figures are mathematical reference points based on dividing 365 days by the stated payment period. They are not performance targets and do not account for invoice timing, disputed balances, customer behavior, seasonality, or other operational factors.
How to Interpret High, Low, or Changing AR Turnover Ratios
A high AR turnover ratio generally points to timely customer payments, effective credit controls, and efficient collections. Those are positive indicators, but they warrant a second look. If the ratio is unusually high, the business may be applying credit policies that are too restrictive, which can limit sales growth and push creditworthy customers away.
A low ratio raises different questions. Slow collections, unresolved invoice disputes, inadequate follow-up, or overextended credit can all push the ratio down. Identifying which factor is driving the result is where the real analytical work begins.
Ratio Interpretation Guide (Illustrative Only, Not Advice)
| Scenario | What It May Signal | What to Check Next |
| High ratio | Timely payments, effective credit controls | Confirm credit policy is not limiting qualified sales |
| Low ratio | Slow collections, disputes, overextended credit | Review aging buckets, dispute logs, follow-up cadence |
| Rising ratio | Improving collections or tightening credit | Compare against payment terms and sales trends |
| Falling ratio | Payment delays, credit drift, billing issues | Check customer concentration, aging, and DSO trend |
Regardless of the direction the ratio moves, analysis across multiple months, quarters, or years provides more context than a single period’s result. Finance teams should evaluate AR turnover alongside aging reports, DSO, invoice disputes, bad-debt trends, write-offs, and customer concentration. Together, these measures provide a more complete picture of receivables performance and help identify what is driving a change.
What Are the Limitations of the AR Turnover Ratio?
The AR turnover ratio is most useful when calculated consistently and evaluated with supporting financial information. Using only beginning and ending receivables balances may produce a misleading result for seasonal businesses or companies with significant fluctuations during the year. In these situations, averaging monthly or quarterly AR balances may provide a more representative calculation.
Results can also be distorted when total sales are used instead of net credit sales, when a few customers account for a large percentage of outstanding receivables, or when significant balances are written off. The ratio also does not identify which invoices or customers are causing collection delays. Finance teams should use aging reports, customer-level payment history, dispute data, and bad-debt trends to investigate the reasons behind the result.
When Small and Mid-Market Companies Should Improve AR Processes
Small and mid-market businesses (SMBs) often recognize the need for AR process improvement when DSO begins rising, aging receivables accumulate, invoicing is delayed, disputes increase, or cash visibility becomes inconsistent. Any one of these signals warrants a closer look. When several appear together, the underlying process, not just individual accounts, likely needs attention.
Growing businesses face compounding complexity. More customers, more entities, more payment methods, and more reporting requirements all strain processes that worked well at smaller scale. Manual spreadsheets and disconnected systems make it harder to identify overdue accounts early, which means finance teams spend more time chasing payments reactively rather than managing collections proactively.
So, when should an SMB improve its process for AR turnover ratio tracking? The honest answer is: “Before the metrics force the issue.” Organizations that build better visibility and process discipline during periods of stable performance are better equipped to manage the volatility that comes with rapid growth, customer expansion, or economic shifts.
How Finance Teams Reduce Manual Work Around AR Reporting
Finance teams reduce manual work by centralizing invoices, payments, collections, reconciliation, reporting, and customer data in a single business management system rather than maintaining parallel processes across spreadsheets and disconnected point tools. Centralization alone removes a significant source of reporting delays and data inconsistency.
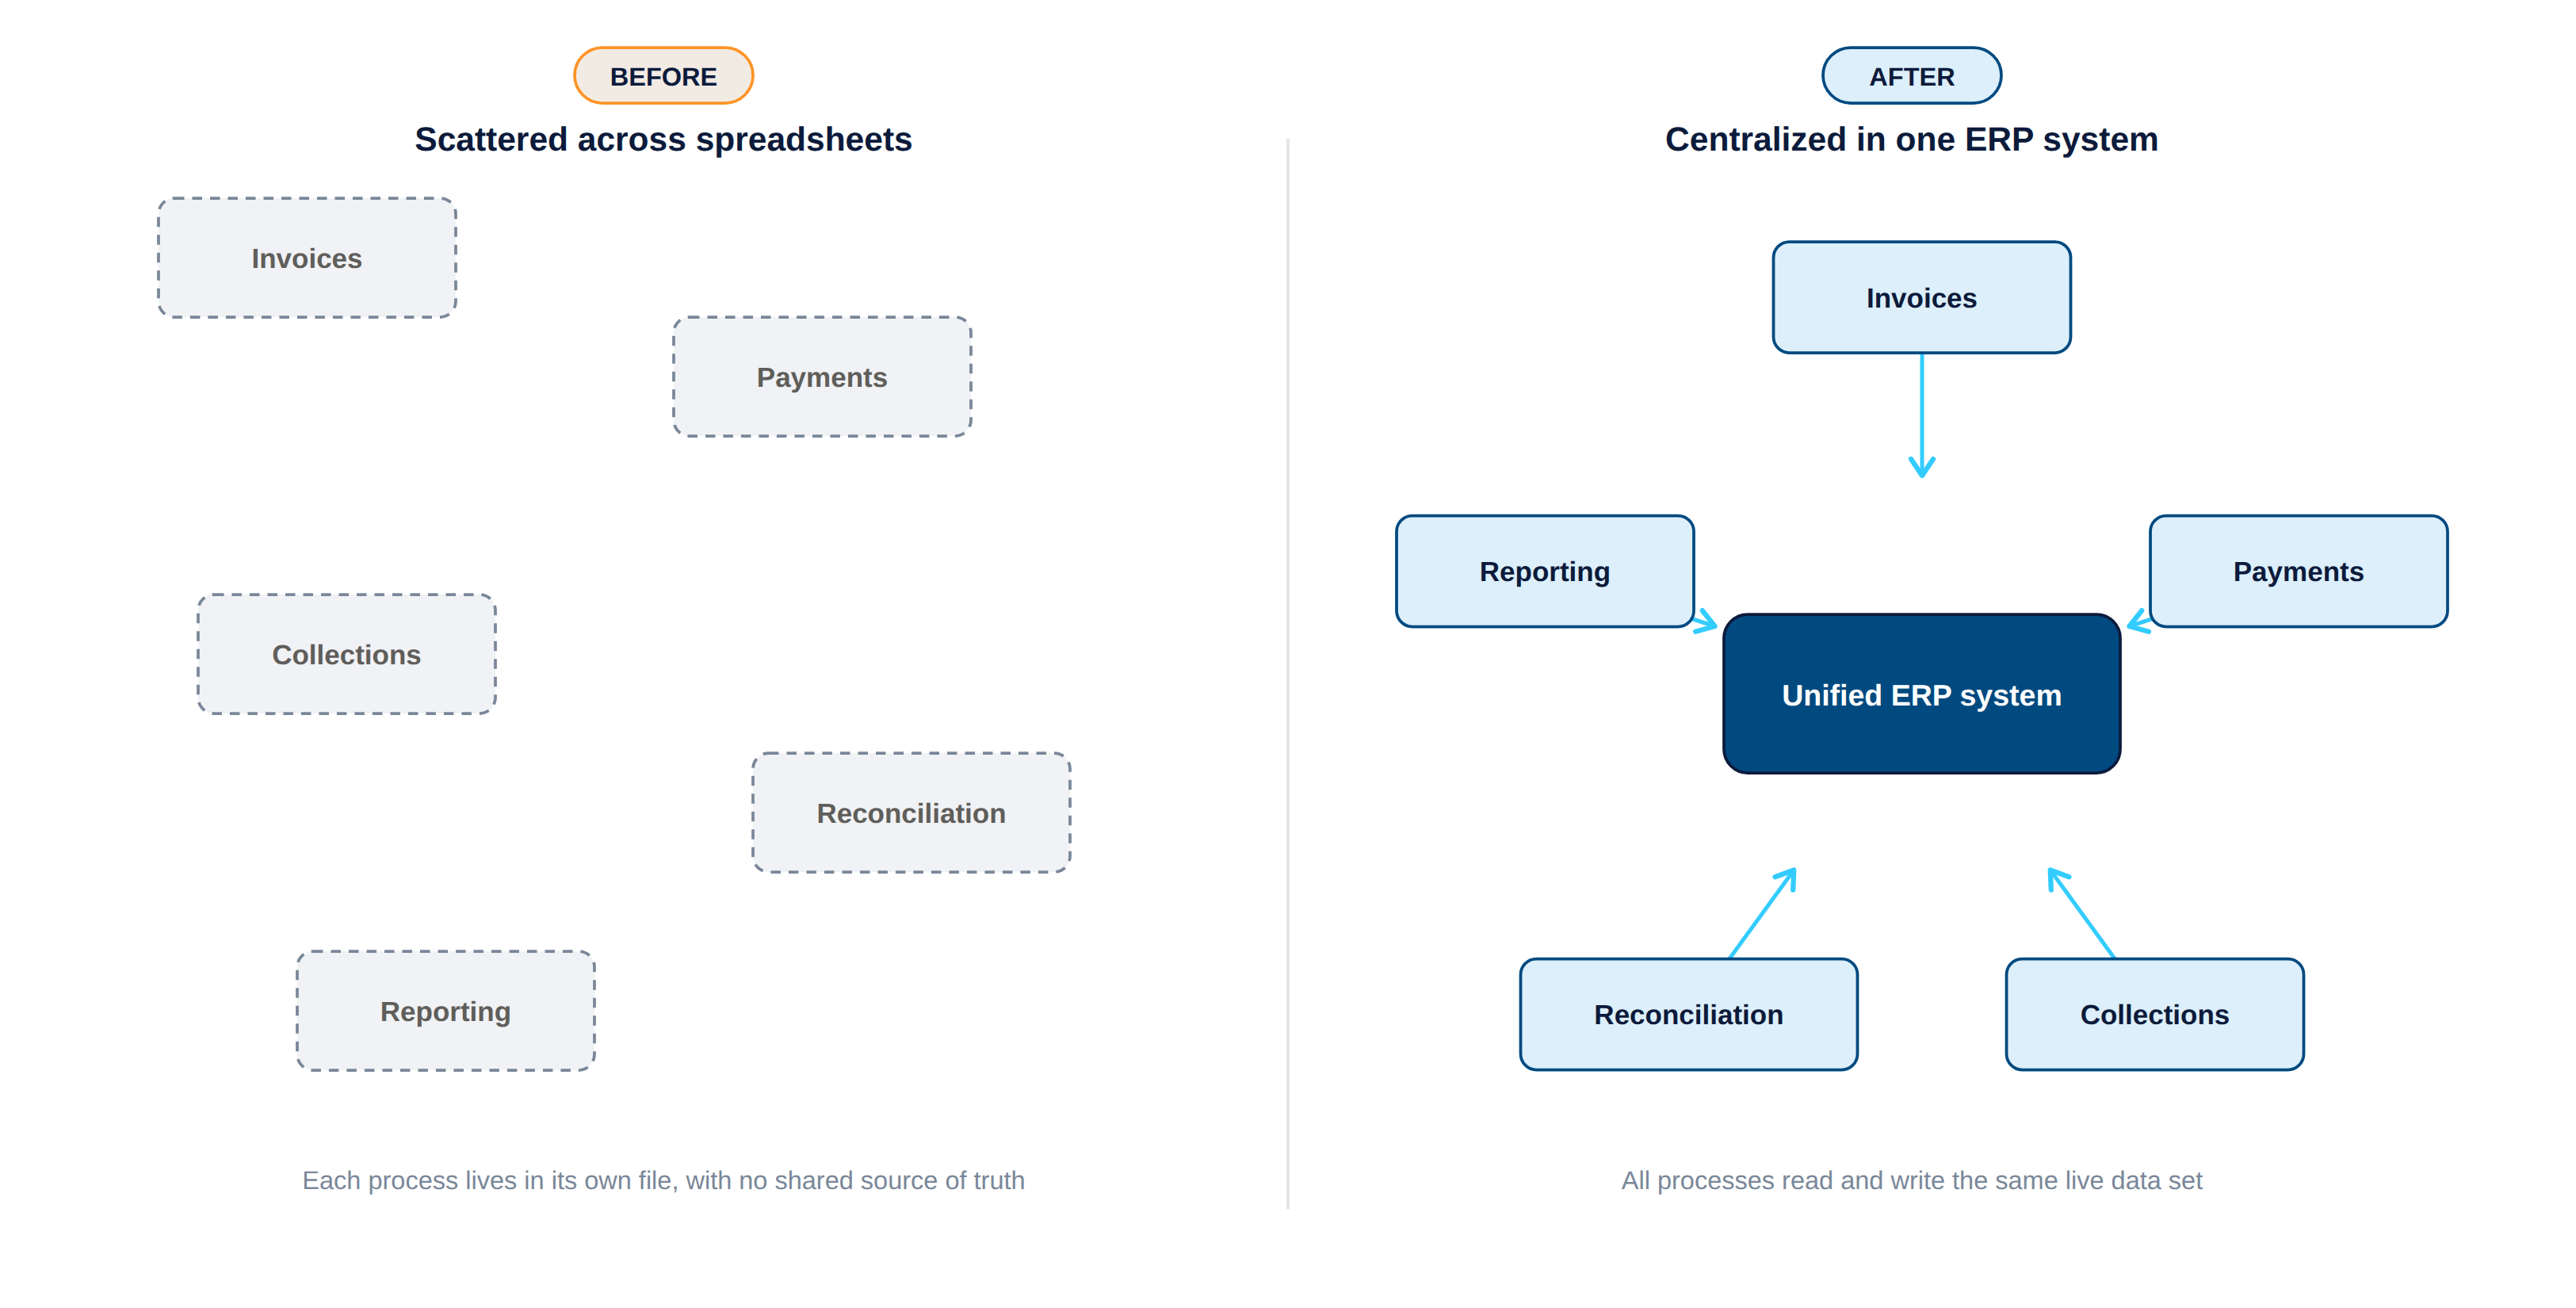
Practical examples of what this looks like in operation include automated aging reports, real-time payment tracking, scheduled customer statements, exception-based alerts, and AR dashboards that update without manual data pulls. These capabilities shift the finance team’s attention from data assembly toward analysis and action. Accounts payable reporting and receivables reporting, when managed through the same platform, help finance leaders see both sides of the working capital equation at once rather than reconciling separate data extracts. That combined view supports faster, more grounded decisions about cash timing and liquidity.
Some ERP solutions now incorporate AI-assisted capabilities that further reduce repetitive work. Acumatica, for example, includes an AI Assistant that allows finance users to ask questions in plain language to surface recent open invoices, list overdue accounts, or compare receivables across periods. Rather than building manual queries, users get answers, charts, and drillable records from their own ERP data. Acumatica’s AI-powered Anomaly Detection can also flag unusual patterns in receivables or payment behavior that deviate from historical norms, so teams can review exceptions before they become larger issues.
How ERP Helps Growing Companies with the AR Turnover Ratio
ERP solutions help finance teams manage the AR turnover ratio more effectively by connecting accounts receivable, accounts payable, the general ledger, cash management, sales, inventory, and customer data in one unified system. That connectivity supports more accurate AR turnover calculations because the data feeding the formula comes from a single source of truth rather than from manually reconciled exports.
Connected financial data also supports more timely reporting. Finance teams no longer need to wait for month-end exports to assess receivables performance. Current balances, aging summaries, and customer payment histories are immediately accessible when decisions need to be made. Acumatica’s accounts receivable software includes invoicing, statements, payments, balance verification, commissions, and customer reports, covering the full receivables workflow within the same platform.
Embedded payment acceptance is another way connected systems reduce friction in the receivables cycle. When customers can pay directly from an invoice or statement, payments are captured and applied without finance teams re-keying transactions or reconciling against a separate processor.
Acumatica supports integrated payment acceptance and automatic application of received payments against open invoices, which removes manual steps between the moment a customer pays and the moment that payment is reflected in AR balances. Fewer handoffs in the process means the receivables data feeding AR turnover and DSO stays current, giving finance teams a more accurate view of where collections actually stand.
The broader shift that ERP solutions enable is from periodic ratio calculation to ongoing performance monitoring. Instead of assembling the AR turnover ratio once per quarter, finance leaders can track it as a live metric alongside DSO, aging buckets, and cash position. That real-time visibility creates room to identify problems earlier and respond with greater precision.
What ERP Features Matter Most for AR Turnover Visibility
The ERP solution features that contribute most directly to AR turnover visibility are real-time reporting, role-based dashboards, automated aging reports, customer-level drill-downs, credit controls, and payment tracking. Together, these capabilities give finance teams the data they need to monitor the ratio as an ongoing metric rather than a periodic calculation.
For growing organizations, multi-entity, multi-currency, and role-based reporting add important layers of functionality. A company managing several business units or operating across borders needs AR visibility that reflects the full picture without requiring manual consolidation. Acumatica reporting and dashboards supports real-time report generation, applied filters, scheduled reports, and customized views, giving finance teams the ability to configure visibility around how their organization actually operates.
AI-assisted reporting and dashboards built into Acumatica also support the tools finance teams use to monitor AR turnover and related KPIs. The AI capabilities are designed to support and accelerate human review, not to replace the professional judgment that belongs with finance leadership. When a dashboard flags an unusual receivables pattern, that signal still requires a qualified person to assess context, determine cause, and decide on the right course of action.
How AR and AP Reporting Improve Working Capital Decisions
AR turnover should not be evaluated in isolation because payables timing affects cash position just as much as collections performance does. Accounts receivable tracks money customers owe to the business; accounts payable tracks money the business owes to vendors and suppliers. Both sides of that equation shape how much cash is available at any given point.
Connected ERP for AP and AR helps finance leaders balance incoming cash, outgoing payments, and liquidity planning without relying on separate reporting processes for each function. When AP and AR reporting share a common data foundation, finance teams can model cash timing more accurately, identify gaps between collection cycles and payment obligations, and make more confident decisions about when to extend credit, accelerate collections, or adjust payment schedules.
Practical Steps to Improve AR Turnover Without Guesswork
Improving AR turnover starts with the basics:
- Invoice promptly after delivery.
- Verify invoice accuracy before sending.
- Define payment terms clearly in customer agreements.
Each of these steps reduces the friction that delays payments, and all three are within the finance team’s direct control.
Beyond the initial invoice, monitoring aging reports consistently and segmenting overdue accounts by size, customer relationship, and payment history helps prioritize follow-up. Not every overdue account carries the same risk, and treating them the same way wastes collection effort. Reviewing credit policies periodically, rather than only when problems surface, ensures that terms remain appropriate as the customer base and business model evolve.
Track AR turnover, AR turnover days, DSO, aging buckets, dispute volume, and write-offs together. No single metric tells the full story, but the combination creates a coherent picture of receivables health that supports better decisions. Document calculation assumptions clearly so that comparisons remain consistent across reporting periods. If the formula inputs change, the trend becomes unreliable.
Modern ERP solutions support this kind of process discipline by standardizing how data is captured, reported, and reviewed. Acumatica’s financial management software helps growing companies build the reporting consistency and operational visibility that underpin a stronger, more proactive approach to receivables management. The goal is not a perfect ratio. It is a finance team that understands what is driving the ratio and knows what to do about it.
Frequently Asked Questions
What is the AR turnover ratio formula?
The AR turnover ratio formula divides net credit sales by average accounts receivable for the same period. Net credit sales equal total credit sales minus returns and allowances. Average accounts receivable equals beginning AR plus ending AR, divided by two. Cash sales should be excluded because they do not generate receivables.
Net Credit Sales = Total Credit Sales – Returns and Allowances
Average Accounts Receivable = (Beginning Accounts Receivable + Ending Accounts Receivable) ÷ 2
AR Turnover Ratio = Net Credit Sales ÷ Average Accounts Receivable
How do I find my company’s AR turnover ratio?
To find your AR turnover ratio, gather net credit sales for your chosen period and calculate average accounts receivable by adding the beginning and ending AR balances and dividing by two. Divide net credit sales by that average. Most ERP solutions can surface this data automatically from connected financial records, removing the need for manual data pulls.
What does a high AR turnover ratio mean?
A high AR turnover ratio generally indicates that customers are paying on time and that collections processes are effective. In some cases, however, it can also reflect credit policies that are too restrictive, which may limit sales to otherwise creditworthy customers. Context matters. Compare the ratio against payment terms and sales trends before drawing conclusions.
What does a low AR turnover ratio mean?
A low AR turnover ratio may indicate slow collections, invoice disputes, inadequate follow-up, or overly lenient credit terms. Reviewing aging reports, dispute logs, and customer payment history helps identify which factor is contributing most to the result.
What is the difference between AR turnover and DSO?
AR turnover measures how many times a company collects its average receivables balance during a period. DSO measures the average number of days it takes to collect payment after a sale. Both metrics are useful and are even better together. AR turnover shows collection frequency while DSO translates that into a time-based figure that can be compared directly against payment terms.
What is a good accounts receivable turnover ratio?
There is no universal AR turnover ratio that is appropriate for every business. A good ratio is one that is consistent with the company’s payment terms, billing model, customer relationships, and cash-flow requirements. Convert the ratio into collection days and compare the result with the payment terms offered to customers. Finance teams should also track whether the ratio is rising, falling, or remaining stable over time.
How does ERP help with AR turnover ratio tracking?
ERP solutions connect accounts receivable, accounts payable, general ledger, cash management, and customer data in one system, which supports more accurate and timely AR turnover calculations. Instead of assembling data manually each period, finance teams can monitor the ratio as a live metric alongside aging reports, DSO, and cash position.
When should a mid-market company improve its AR process?
The clearest signals include rising DSO, accumulating aging receivables, delayed invoicing, frequent disputes, and inconsistent cash visibility. Companies that build better AR visibility and process discipline before these signals become acute are better positioned to manage the complexity that comes with growth.
What should I compare my AR turnover ratio against?
Compare the ratio against your company’s stated payment terms, previous reporting periods, budget or cash-flow expectations, and changes in customer payment behavior. Industry characteristics can help explain why collection cycles differ, but internal trends and agreed payment terms generally provide the most relevant basis for evaluating performance.
How does seasonality affect the accounts receivable turnover ratio?
Seasonal changes in sales and invoicing can make beginning and ending AR balances unrepresentative of the full reporting period. For seasonal businesses, calculating average accounts receivable from monthly or quarterly balances may produce a more accurate result. Finance teams should also compare equivalent periods, such as the same quarter year over year, rather than comparing peak and off-season periods directly.


