
 Canada (English)
 Colombia
 Caribbean and Puerto Rico
 Ecuador
 India
India
 Indonesia
 Ireland
 Malaysia
 Mexico
 Panama
 Peru
Peru
 Philippines
 Singapore
 South Africa
 Sri Lanka
 Thailand
 United Kingdom
 United States
 AcumatiCares


Financial key performance indicators, or KPIs, help CFOs, controllers, and business leaders evaluate financial health, monitor risk, and make informed decisions. Unlike general financial metrics, KPIs are tied to specific objectives, targets, owners, and review cadences.
The challenge is not simply collecting more financial data. Finance teams must select KPIs that connect profitability, cash flow, liquidity, operational efficiency, and growth—and then define and review those KPIs consistently.
This guide explains which financial KPIs matter most for CFOs and controllers, how the two roles use them differently, how to organize KPIs by category, and how modern ERP for finance leaders can reduce the manual reporting work.
Key Takeaways
- Financial KPIs are most valuable when tied to specific objectives, reviewed consistently, and owned by accountable people.
- Profitability, liquidity, cash flow, and efficiency KPIs each serve a different purpose and should be evaluated together rather than in isolation.
- A profitable company can still face serious cash pressure. Tracking both earnings and liquidity KPIs is essential for a complete picture.
- Efficiency KPIs often reveal where finance, operations, sales, and supply chain performance intersect, making them useful for cross-functional conversations.
- Modern ERP systems support KPI visibility through centralized data, dashboards, and workflow automation, reducing reliance on manual spreadsheet reporting.
- KPI selection, metric definitions, and reporting practices should align with your company’s accounting policies, industry, and regulatory obligations, and be reviewed with qualified finance, accounting, or audit professionals.
What Finance Leaders Should Know About Financial KPIs
Financial KPIs are strategic indicators that give CFOs and controllers the context to act on data rather than simply report it. But not every metric qualifies as a KPI. A metric (i.e., a quantifiable data measurement that evaluates business performance) becomes a KPI when it is linked to a clear objective, tracked consistently over time, and used to inform a decision or trigger a review. Revenue, for example, is a metric. Revenue growth rate compared to plan and prior year, reviewed monthly by the CFO to inform hiring and capital decisions, is a KPI.
One of the most common mistakes finance teams make is reviewing KPIs as isolated snapshots. A single quarter of strong gross margin means little without context: Is it improving or declining? Is it above or below target? How does it compare to industry peers? Trend analysis, target comparisons, and consistent metric definitions are what transform financial data into decision-ready intelligence.
Why Financial KPIs Matter for Growth and Risk Control
Financial KPIs connect directly to the decisions that shape an organization’s direction, from budget planning and capital allocation to hiring, market expansion, and cost control. But, beyond strategy, KPIs serve as an early warning system. Rising days sales outstanding (DSO), compressing margins, or weakening operating cash flow can each signal emerging risk before it becomes a more serious financial problem.
Reviewed individually, any one of these signals might be dismissed as a temporary fluctuation. Reviewed together, they often tell a more complete and more urgent story. That interconnection is why KPI frameworks are built around categories rather than single metrics.
What Is the Difference Between Leading and Lagging Financial KPIs?
A complete KPI framework includes both leading and lagging indicators. Leading financial KPIs provide signals about potential future performance. Rising DSO, declining inventory turnover, increasing forecast variance, and changes in the sales pipeline may reveal emerging cash flow or performance risks.
Lagging financial KPIs measure results already achieved. Examples include net profit margin, operating cash flow, revenue growth rate, and return on assets. Reviewing both types helps CFOs and controllers understand current financial results while identifying conditions that may affect future performance.
Core Financial KPI Categories CFOs Should Prioritize
The right KPI mix for an organization depends on its business model, its growth stage, its industry, and the cadence at which leadership makes financial decisions. While there is no universal list, financial KPIs typically fall into several broad categories, and each category answers different questions about financial health.
Financial KPIs generally fall into five categories:
Profitability: Is the company converting revenue into sustainable earnings?
Cash Flow and Liquidity: Is the company generating sufficient cash and able to meet its financial obligations?
Efficiency: How effectively is the company using its assets, working capital, and operational resources?
Leverage and Solvency: Can the company support its debt obligations and maintain long-term financial stability?
Growth: Is the company expanding at a sustainable rate?
Core Financial KPI Categories for CFOs
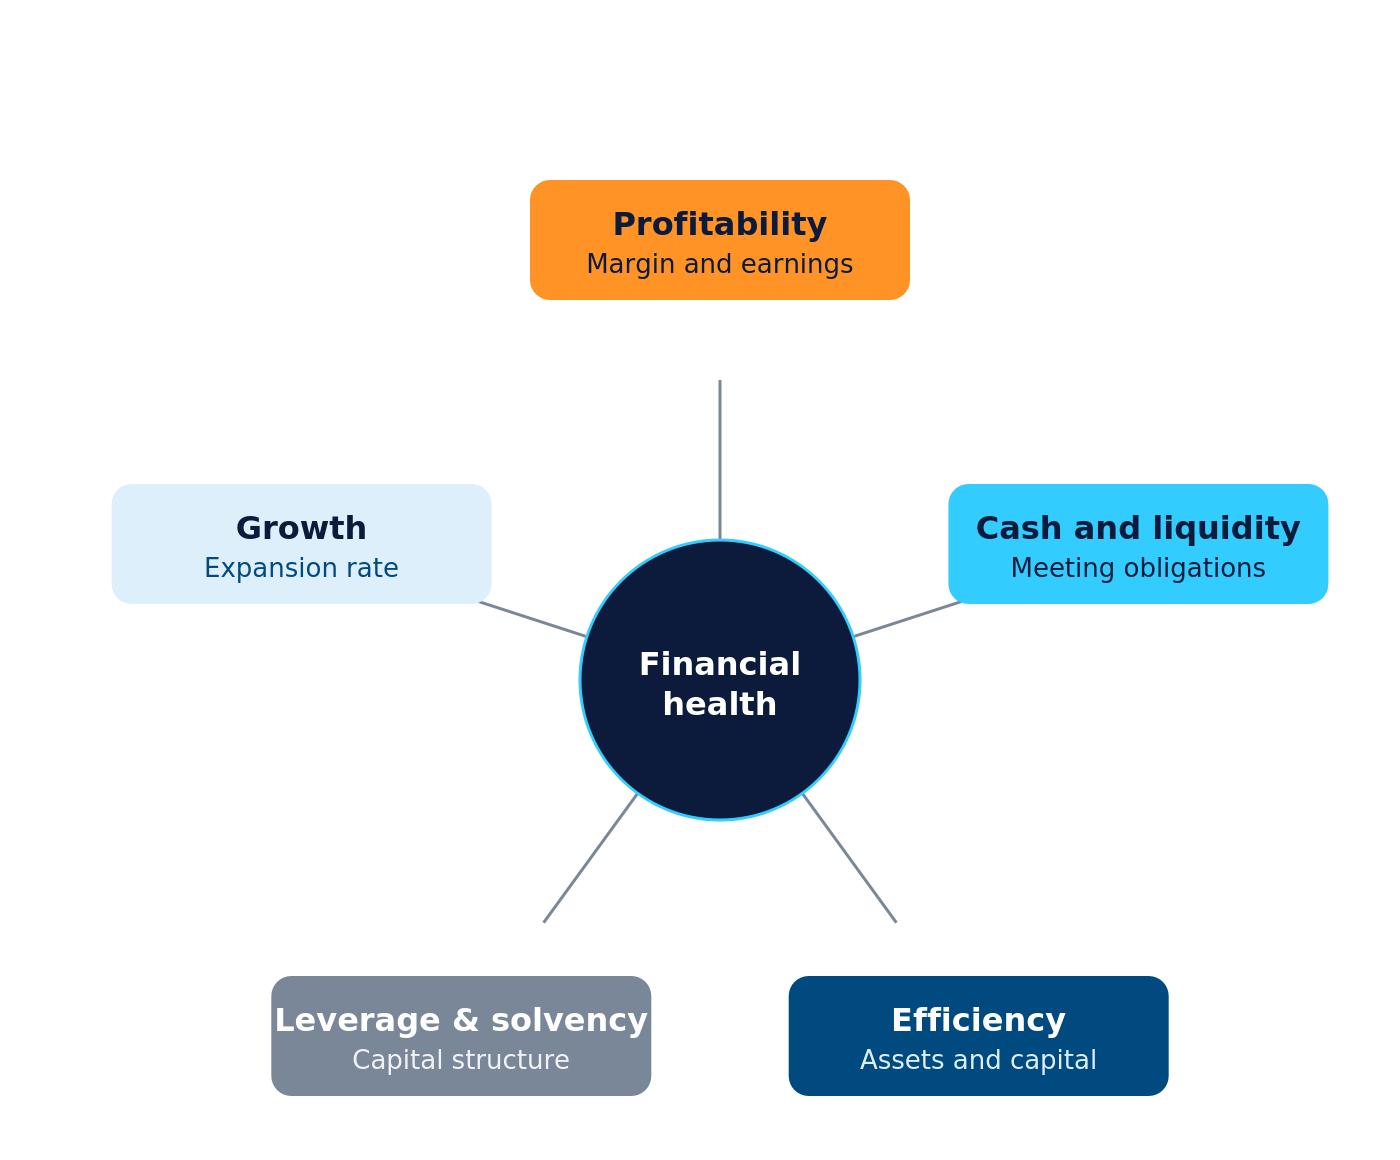
Grouping KPIs by category makes it easier to assign ownership, establish a review cadence, and connect each metric to the decisions it should support. Profitability, cash flow and liquidity, and efficiency form the foundation for most organizations, while leverage and growth KPIs provide additional context for financing, investment, and expansion decisions.
CFOs and controllers often review the same financial information, but they use KPIs for different decisions. The following table summarizes the typical differences.
| KPI Category | CFO Priorities | Controller Priorities | Primary Question |
|---|---|---|---|
|
Profitability |
EBITDA margin, net profit margin, revenue growth | Gross margin, operating expense ratio | Is the company generating sustainable earnings? |
|
Cash Flow and Liquidity |
Operating cash flow, free cash flow, current ratio | DSO, DPO, cash conversion cycle | Can the company fund operations and meet its obligations? |
|
Efficiency |
Return on assets, asset turnover | AR turnover, AP turnover, inventory turnover | How effectively are resources and working capital being used? |
|
Leverage and Solvency |
Debt-to-equity ratio, interest coverage | Debt compliance and payment measures | Is the company’s capital structure sustainable? |
|
Financial Processes |
Forecast accuracy, budget variance | Days to close, reconciliation completion | How reliable and efficient are finance processes? |
Profitability KPIs That Show Margin and Earnings Health
Profitability KPIs measure whether revenue is translating into sustainable earnings at each level of the income statement.
Gross Profit Margin
Gross Profit Margin ((Revenue – Cost of Goods Sold) ÷ Revenue) shows how much revenue remains after direct production or service-delivery costs. CFOs and controllers use it to evaluate pricing, product mix, purchasing costs, and production efficiency.
Operating Profit Margin
Operating Profit Margin (Operating Income ÷ Revenue) measures the profitability of core operations after accounting for operating expenses but before interest and taxes. A declining operating margin may indicate that overhead or operating costs are rising faster than revenue.
EBITDA Margin
EBITDA Margin (EBITDA ÷ Revenue) measures operating earnings before interest, taxes, depreciation, and amortization. It can help finance leaders compare operational performance across periods, business units, or organizations with different financing and asset structures.
Net Profit Margin (Net Income ÷ Revenue) is the bottom-line measure of overall profitability after all expenses, interest, and taxes.
Net Profit Margin (Net Income ÷ Revenue) measures how much revenue remains as profit after all operating expenses, interest, and taxes. It provides a bottom-line view of profitability but should be evaluated alongside cash flow because positive net income does not necessarily mean the company is generating sufficient cash.
Cash Flow and Liquidity KPIs That Reveal Resilience
Profitability and liquidity measure different things. A company can be profitable on paper and still face cash pressure if receivables are slow, inventory is tied up, or payables are accelerating.
Operating Cash Flow
measures the cash generated by core business operations. Under the indirect method, it begins with net income and adjusts for noncash expenses and changes in operating assets and liabilities. Because working-capital changes do not all affect cash in the same direction, the formula is often summarized as:
Operating Cash Flow = Net Income + Noncash Expenses ± Changes in Working Capital
Free Cash Flow (Operating Cash Flow – Capital Expenditures) estimates the cash remaining after the company funds its operations and capital investments.
Current Ratio (Current Assets ÷ Current Liabilities) measures whether the company has enough current assets to cover short-term obligations.
Quick Ratio ((Cash + Marketable Securities + Accounts Receivable) ÷ Current Liabilities) provides a more conservative liquidity view by excluding inventory and other less-liquid current assets.
Days Sales Outstanding (DSO) ((Average Accounts Receivable ÷ Net Credit Sales) × Number of Days in the Period) estimates the average time it takes to collect customer payments.
Days Inventory Outstanding (DIO) ((Average Inventory ÷ Cost of Goods Sold) × Number of Days in the Period) estimates how long inventory is held before it is sold.
Days Payable Outstanding (DPO) ((Average Accounts Payable ÷ Credit Purchases) × Number of Days in the Period) estimates how long the company takes to pay suppliers. When credit-purchase data is unavailable, companies sometimes use cost of goods sold as an approximation.
Cash Conversion Cycle (DSO + DIO – DPO) estimates how long it takes to convert investments in inventory and other operating resources into cash.
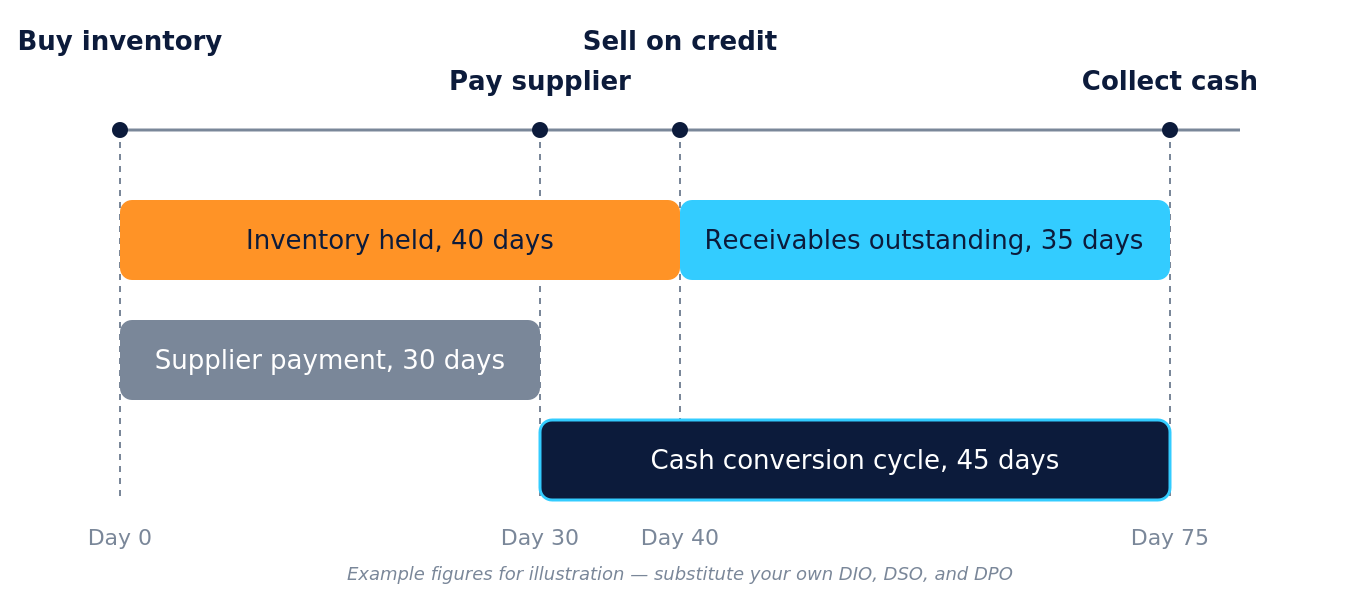
A rising DSO may indicate slower collections, billing delays, customer disputes, or changes in payment behavior. Finance teams should review it alongside AR aging, operating cash flow, and customer-level payment trends before drawing conclusions.
For small to midsized businesses (SMBs) managing growth, multi-entity operations, or significant inventory, these liquidity KPIs often require more frequent review than monthly. They are where cash flow problems tend to appear earliest.
Efficiency KPIs That Expose Process and Cost Issues
Efficiency KPIs help controllers and finance teams identify where resources are being used well and where waste, bottlenecks, or process gaps may be eroding performance.
Accounts Receivable Turnover (Net Credit Sales ÷ Average Accounts Receivable) measures how efficiently the company converts credit sales into cash. A declining ratio may indicate slower collections or changes in customer credit quality.
Accounts Payable Turnover (Net Credit Purchases ÷ Average Accounts Payable) measures how quickly the company pays suppliers. The ratio should be evaluated alongside cash availability, supplier terms, and early-payment discounts.
Inventory Turnover (Cost of Goods Sold ÷ Average Inventory) measures how often inventory is sold and replaced during a period. A falling ratio may indicate excess inventory, slowing demand, or purchasing and forecasting problems.
Operating Expense Ratio (Operating Expenses ÷ Revenue) shows how much of each revenue dollar is consumed by operating costs.
Return on Assets (Net Income ÷ Average Total Assets) measures how effectively the company uses its asset base to generate earnings.
Asset turnover (Revenue ÷ Average Total Assets) measures how efficiently assets generate revenue.
These KPIs sit at the intersection of finance, operations, sales, and supply chain. When AR turnover slows, the cause may be in billing, collections, or customer payments. When inventory turnover falls, the root may be in purchasing, forecasting, or demand planning. Efficiency KPIs are often where cross-functional conversations begin and where the most actionable process improvements can be made.
Growth KPIs That Measure Business Momentum
Growth KPIs help CFOs evaluate whether the company is expanding at a sustainable rate and whether investments in people, products, markets, and capacity are producing results.
Revenue Growth Rate (((Current-Period Revenue – Prior-Period Revenue) ÷ Prior-Period Revenue) × 100) measures the percentage change in revenue between comparable periods.
Gross Profit Growth Rate applies the same calculation to gross profit and helps finance leaders determine whether earnings capacity is growing alongside revenue.
Revenue per Employee (Revenue ÷ Average Number of Employees) provides context on whether workforce growth is translating into increased business output.
Growth should be evaluated alongside profitability and cash flow. Rapid revenue growth may create working-capital pressure if receivables, inventory, or operating expenses increase faster than cash collections.
Leverage and Solvency KPIs That Show Financial Risk
Leverage and solvency KPIs help CFOs evaluate the company’s capital structure, ability to service debt, and long-term financial stability.
Debt-to-Equity Ratio (Total Debt ÷ Shareholders’ Equity) compares financing from creditors with financing from owners. A higher ratio generally indicates greater financial leverage, but appropriate levels vary considerably by industry and business model.
Debt-to-Assets Ratio (Total Debt ÷ Total Assets) shows the proportion of assets financed through debt.
Interest Coverage Ratio (EBIT ÷ Interest Expense) estimates the company’s ability to cover interest payments with operating earnings.
These ratios should be reviewed together and interpreted in the context of the company’s industry, cash flow stability, lending agreements, and growth strategy.
Financial-Process KPIs Controllers Should Track
Controllers also need KPIs that measure the accuracy, consistency, and efficiency of financial operations. These measures complement traditional profitability and liquidity KPIs by showing whether the finance team can produce reliable information on time.
Common financial-process KPIs include:
Days to close: The number of days required to complete the financial close after a reporting period ends.
Reconciliation completion rate: The percentage of required account reconciliations completed by the deadline.
Post-close adjustments: The number or value of adjustments recorded after the financial statements were initially prepared.
Forecast accuracy: The difference between forecasted and actual financial results.
Budget variance: The difference between budgeted and actual revenue or expenses.
Transaction automation rate: The percentage of eligible financial transactions processed without manual entry.
These KPIs can reveal bottlenecks, data-quality problems, control gaps, and opportunities for automation.
How ERP Systems Help Growing Companies Manage Financial KPIs
Modern ERP platforms support financial KPI management by connecting financial data across accounts payable, accounts receivable, general ledger, cash management, and other modules in a single system. Finance leaders have access to real-time KPI data through role-based dashboards and can drill down from summary views to underlying transactions without waiting for a manual export.
How Finance Teams Reduce Manual KPI Reporting Work
Manual KPI reporting creates real, recurring costs for finance teams, including spreadsheet consolidations, duplicate data entry, inconsistent metric definitions, delayed report delivery, and version-control conflicts when multiple people edit the same workbooks. ERP platforms reduce this friction by consolidating financial data in a single system of intelligence, automating routine workflows, and supporting dashboards that update in real time. When data flows directly from transactions into reports and dashboards, finance teams spend less time assembling numbers and more time reviewing and acting on them. But one of the biggest keys here is automation.
Acumatica brings information from accounts payable, accounts receivable, general ledger, cash management, inventory, projects, and other connected business areas into a shared ERP platform. Role-based dashboards can present the KPIs most relevant to each finance user, while drill-down capabilities allow authorized users to move from summary results to the underlying transactions and documents.
Acumatica also provides AI-enabled capabilities designed to help finance teams identify exceptions and evaluate business information more efficiently. For example, anomaly detection can flag unusual general-ledger transactions for review. Dashboard, reporting, forecasting, and analytical capabilities can help finance leaders monitor measures such as margins, DSO, revenue, utilization, project profitability, cash flow, and inventory costs.
Automation and AI support—but do not replace—financial judgment. Finance leaders remain responsible for metric definitions, accounting policies, reporting standards, internal controls, and decisions based on the results.
What Features Matter When Evaluating Financial KPI Tools?
The most important qualities in a financial KPI tool are data integrity, reporting consistency, and the ability to connect metrics to decisions through clear, timely visibility.
Finance leaders evaluating financial KPI tools should prioritize data integrity, consistent metric definitions, timely reporting, and the ability to move from a KPI result to the transactions and operational activities behind it.
- Data integration: Consolidates relevant financial and operational data across systems, entities, currencies, departments, and locations.
- Timely reporting: Updates KPI results frequently enough to support the decisions associated with them.
- Drill-down capabilities: Allows users to investigate the transactions and records behind a result or variance.
- Audit trails and security: Protects sensitive information and documents changes, approvals, and user activity.
- Multi-entity support: Provides consistent reporting across subsidiaries, divisions, entities, and currencies.
- Customizable dashboards: Presents the KPIs most relevant to each role without requiring every user to work from the same dashboard.
- Targets and alerts: Compares actual results with targets and flags material variances for review.
- Consistent definitions: Helps finance teams use the same formulas, time periods, and data sources throughout the organization.
Financial KPI Dashboards Should Support Decisions
A financial KPI dashboard should do more than display current values. It should help users understand whether performance is improving, how results compare with targets, and where investigation may be required. Useful dashboards combine actual results, targets, period-over-period trends, variances, and access to the underlying details.
Acumatica dashboards support role-specific configuration, real-time data updates, and drill-down access from summary KPI widgets to the underlying transactions and records. This structure makes it practical for different stakeholders to work from a shared financial system while seeing the information most relevant to their decisions.
When Small and Mid-Market Companies Should Improve KPI Processes
Small and mid-market companies should improve their financial KPI processes when reporting delays, inconsistent definitions, or limited cash visibility begin to affect decision-making. These problems often become more visible as transaction volumes increase, operations expand, or the company adds entities, locations, currencies, and reporting requirements.
These are signals of a data, process, and governance challenge, not simply a software gap. Improving KPI processes requires defining a core metric set, documenting formulas, assigning owners, and aligning your reporting cadence to the decisions those KPIs inform. Technology supports the human judgment behind this work.
A practical starting point is to audit current reporting by asking:
- Which KPIs are we tracking?
- How are they defined?
- Who owns them?
- How often are they reviewed and by whom?
The answers often reveal gaps in consistency and ownership that are addressable as you plan to introduce new tools.
Building a Practical Financial KPI Framework That Scales
A scalable financial KPI framework follows a clear, seven-step sequence:
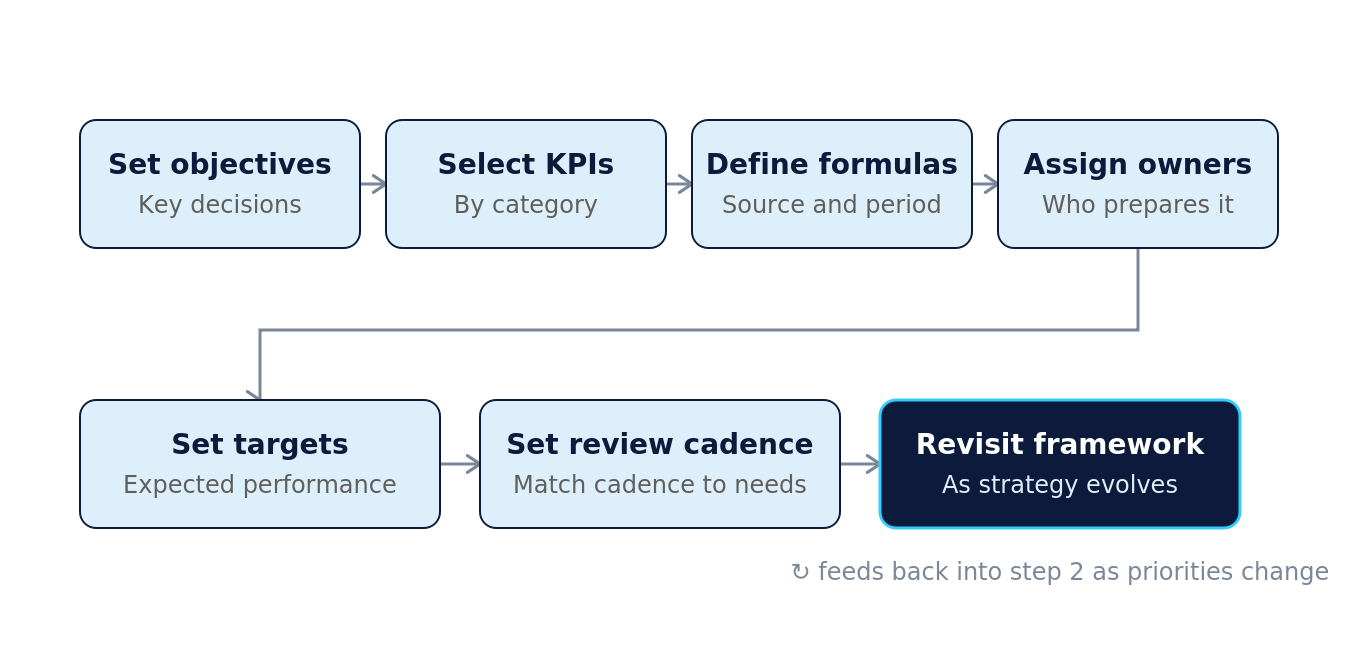
- Define strategic objectives. Identify the financial and operational decisions the KPI framework must support.
- Select KPIs by category. Choose a focused set covering profitability, cash flow, liquidity, efficiency, leverage, growth, and finance processes as appropriate.
- Standardize formulas. Document the formula, data source, accounting treatment, and reporting period for each KPI.
- Assign ownership. Designate the person responsible for preparing, reviewing, explaining, and acting on each KPI.
- Set targets. Define expected performance and the conditions that should trigger investigation.
- Establish a review cadence. Match weekly, monthly, or quarterly reviews to the frequency of the related decisions.
- Revisit the framework as the business evolves. Update the KPI set as the company’s strategy, structure, risks, and reporting needs change.
No framework survives unchanged through a company’s growth. The KPIs that serve a 50-person company well may not meet the needs of a 250-person multi-entity organization. Building in a regular review cadence, quarterly or annually, ensures the framework stays aligned with business priorities.
The table below illustrates a sample CFO and controller KPI scorecard. It is intended as a practical reference, not a prescriptive template. Metric definitions, targets, and cadence should be adapted to your company’s accounting policies, industry, reporting obligations, and regulatory environment.
| KPI | Owner | Formula | Cadence | Decision Supported |
|---|---|---|---|---|
|
Gross Profit Margin |
CFO / Controller | Gross Profit ÷ Revenue | Monthly | Pricing, COGS management |
|
EBITDA Margin |
CFO | EBITDA ÷ Revenue | Monthly | Operational performance, investor reporting |
|
Net Profit Margin |
CFO | Net Income ÷ Revenue | Monthly | Overall profitability review |
|
Operating Cash Flow |
CFO / Controller | (Net Income + Non-Cash Expenses) – Change in Working Capital | Monthly | Liquidity assessment, capital planning |
|
Free Cash Flow |
CFO | Operating Cash Flow – Capital Expenditures | Monthly | Investment decisions, debt management |
|
Current Ratio |
Controller | Current Assets ÷ Current Liabilities | Monthly | Short-term liquidity review |
|
DSO |
Controller | (Accounts Receivable ÷ Revenue) × Number of Days in Chosen Period | Weekly or Monthly | Collections performance, cash timing |
|
DPO |
Controller | (Accounts Payable ÷ COGS) × Number of Days in Chosen Period | Monthly | Payables management, vendor terms |
|
Cash Conversion Cycle |
Controller | (DSO + DIO) – DPO | Monthly | Working capital efficiency |
|
AR Turnover |
Controller | Net Credit Sales ÷ Average AR | Monthly | Receivables efficiency |
|
Inventory Turnover |
Controller / Operations | COGS ÷ Average Inventory | Monthly | Inventory management, demand planning |
|
Operating Expense Ratio |
CFO / Controller | Operating Expenses ÷ Revenue | Monthly | Cost discipline, overhead review |
|
Return on Assets |
CFO | Net Income ÷ Total Assets | Quarterly | Asset productivity |
|
Revenue Growth Rate |
CFO | (Current Period Revenue – Prior Period Revenue) ÷ Prior Period Revenue | Monthly | Top-line growth, planning |
These cadences are illustrative. Organizations should adjust KPI definitions, ownership, targets, and review schedules based on their business models, industries, accounting policies, and decision requirements.
Financial KPIs create value when they connect reliable data with clear ownership and defined decisions. A focused scorecard that finance leaders review consistently is more useful than an extensive metric library that rarely leads to action.
As companies grow, manual reporting and disconnected data can make KPI results slower and less consistent. Cloud ERP software can provide a foundation for centralized financial data, automated workflows, role-based dashboards, and drill-down reporting that helps CFOs and controllers keep KPIs current and decision-ready.
Frequently Asked Questions About Financial KPIs for CFOs and Controllers
What Are the Most Important Financial KPIs for CFOs and Controllers?
Important financial KPIs include gross profit margin, EBITDA margin, net profit margin, operating cash flow, free cash flow, current ratio, DSO, cash conversion cycle, AR turnover, inventory turnover, debt-to-equity ratio, and revenue growth rate. CFOs generally emphasize strategic performance, cash flow, growth, and capital allocation. Controllers often place greater emphasis on working capital, reporting accuracy, controls, and financial-process efficiency.
How Are CFO KPIs Different from Controller KPIs?
CFO KPIs tend to focus on profitability, forecasting, capital allocation, financing, growth, and long-term financial performance. Controller KPIs typically focus on reporting accuracy, working capital, close efficiency, reconciliations, controls, and transaction processing. The two roles frequently review the same data but use it at different cadences and for different decisions.
What Is the Difference Between Leading and Lagging Financial KPIs?
Leading KPIs provide signals about potential future performance. Examples include DSO trends, inventory turnover, forecast variance, and sales-pipeline measures. Lagging KPIs, such as net profit margin, operating cash flow, and return on assets, measure results already achieved. Finance teams should review both types to understand current performance and identify emerging risks.
How Often Should Finance Teams Review Financial KPIs?
The appropriate review cadence depends on the KPI and the decision it supports. Cash availability, collections, and DSO may require weekly review. Profitability, working capital, budget variance, and close-process KPIs are commonly reviewed monthly. Capital structure, return on assets, and longer-term growth measures may be reviewed quarterly. Companies should avoid applying the same cadence to every KPI.
How Does ERP Software Support Financial KPI Reporting?
ERP software centralizes data from accounts payable, accounts receivable, general ledger, cash management, inventory, projects, and other connected business functions. Role-based dashboards, automated workflows, consistent data definitions, and drill-down reporting can reduce manual consolidation and help CFOs and controllers investigate KPI results more efficiently.
What Should Mid-Market Companies Do First to Improve Financial KPI Tracking?
Start by selecting five to ten KPIs tied directly to current business priorities. Document the formula and data source for each KPI, assign an owner, define a target or review threshold, and establish an appropriate cadence. Then determine whether existing systems can produce the information consistently and trace results to the underlying transactions.


