Welcome back to our series on the Acumatica Report Designer! In Part One, we explored some tips and tricks for getting started with the tool, including using the Wizard to create a basic report, customizing data sources, and taking advantage of formatting options.
In Part Two, we’ll delve deeper into some advanced features of the Acumatica Report Designer that can help you create even more powerful and sophisticated reports.
Summations with Conditional Clauses
Instead of looping through each section and calculating the sum of a formula using variables, you can use the SUM function in the group header and input the formula as part of the arguments for an easier approach.
Example:
=SUM(IIF([ARTax.TaxRate]=0, [ARTran.TranAmt], 0))
The SUM function should be placed in the appropriate section and will work with the grouping used. It should be noted that the system applies the condition field across the entire dataset in the group, similar to SQL, rather than using the condition formula against the last record/row displayed.
Notification Templates for Mailing Reports
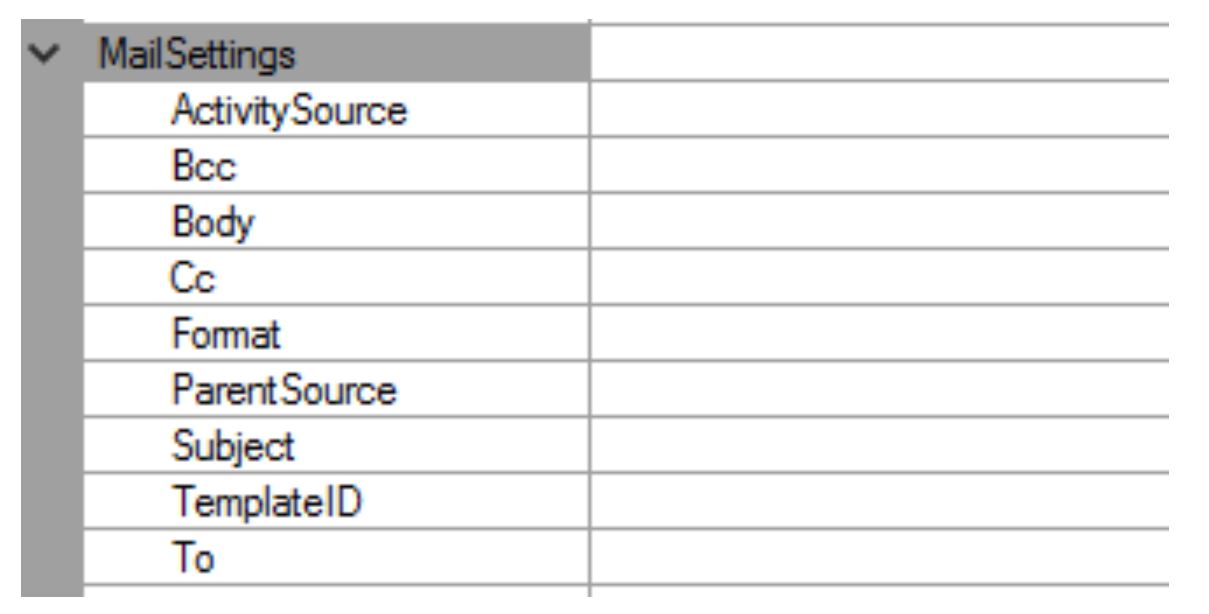
In the Mail Settings, if you set specific values in either of the below fields, the system will override the default Notification Template Set (even though the Template ID is empty).

If a Notification Template is defined, and:
- The field is populated above, this value overrides that defined in the notification template.
- The field above is left empty, the notification template value for the corresponding field will be used.
Use Subreports to Display Data from Multiple Data Sources in a Single Report
Sometimes, you may want to display data from multiple data sources in a single report. For example, you might want to show data from an invoices table as well as data from a customer table in a single report. To do this, you can use a subreport. A subreport is a report within a report that allows you to display data from multiple data sources in a single report.
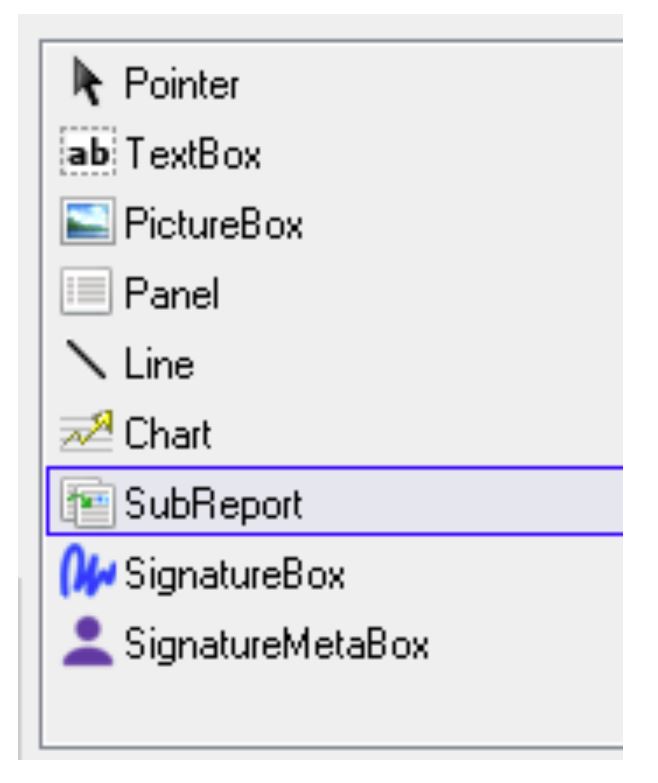
To create and use a subreport, first, you need to create a separate report with the other data source, in this case, the customer. For this report, you would need to define CustomerID as a parameter. Once the subreport is finished, on the main report drag a “Sub-Report” object to the section you want it to be displayed in.

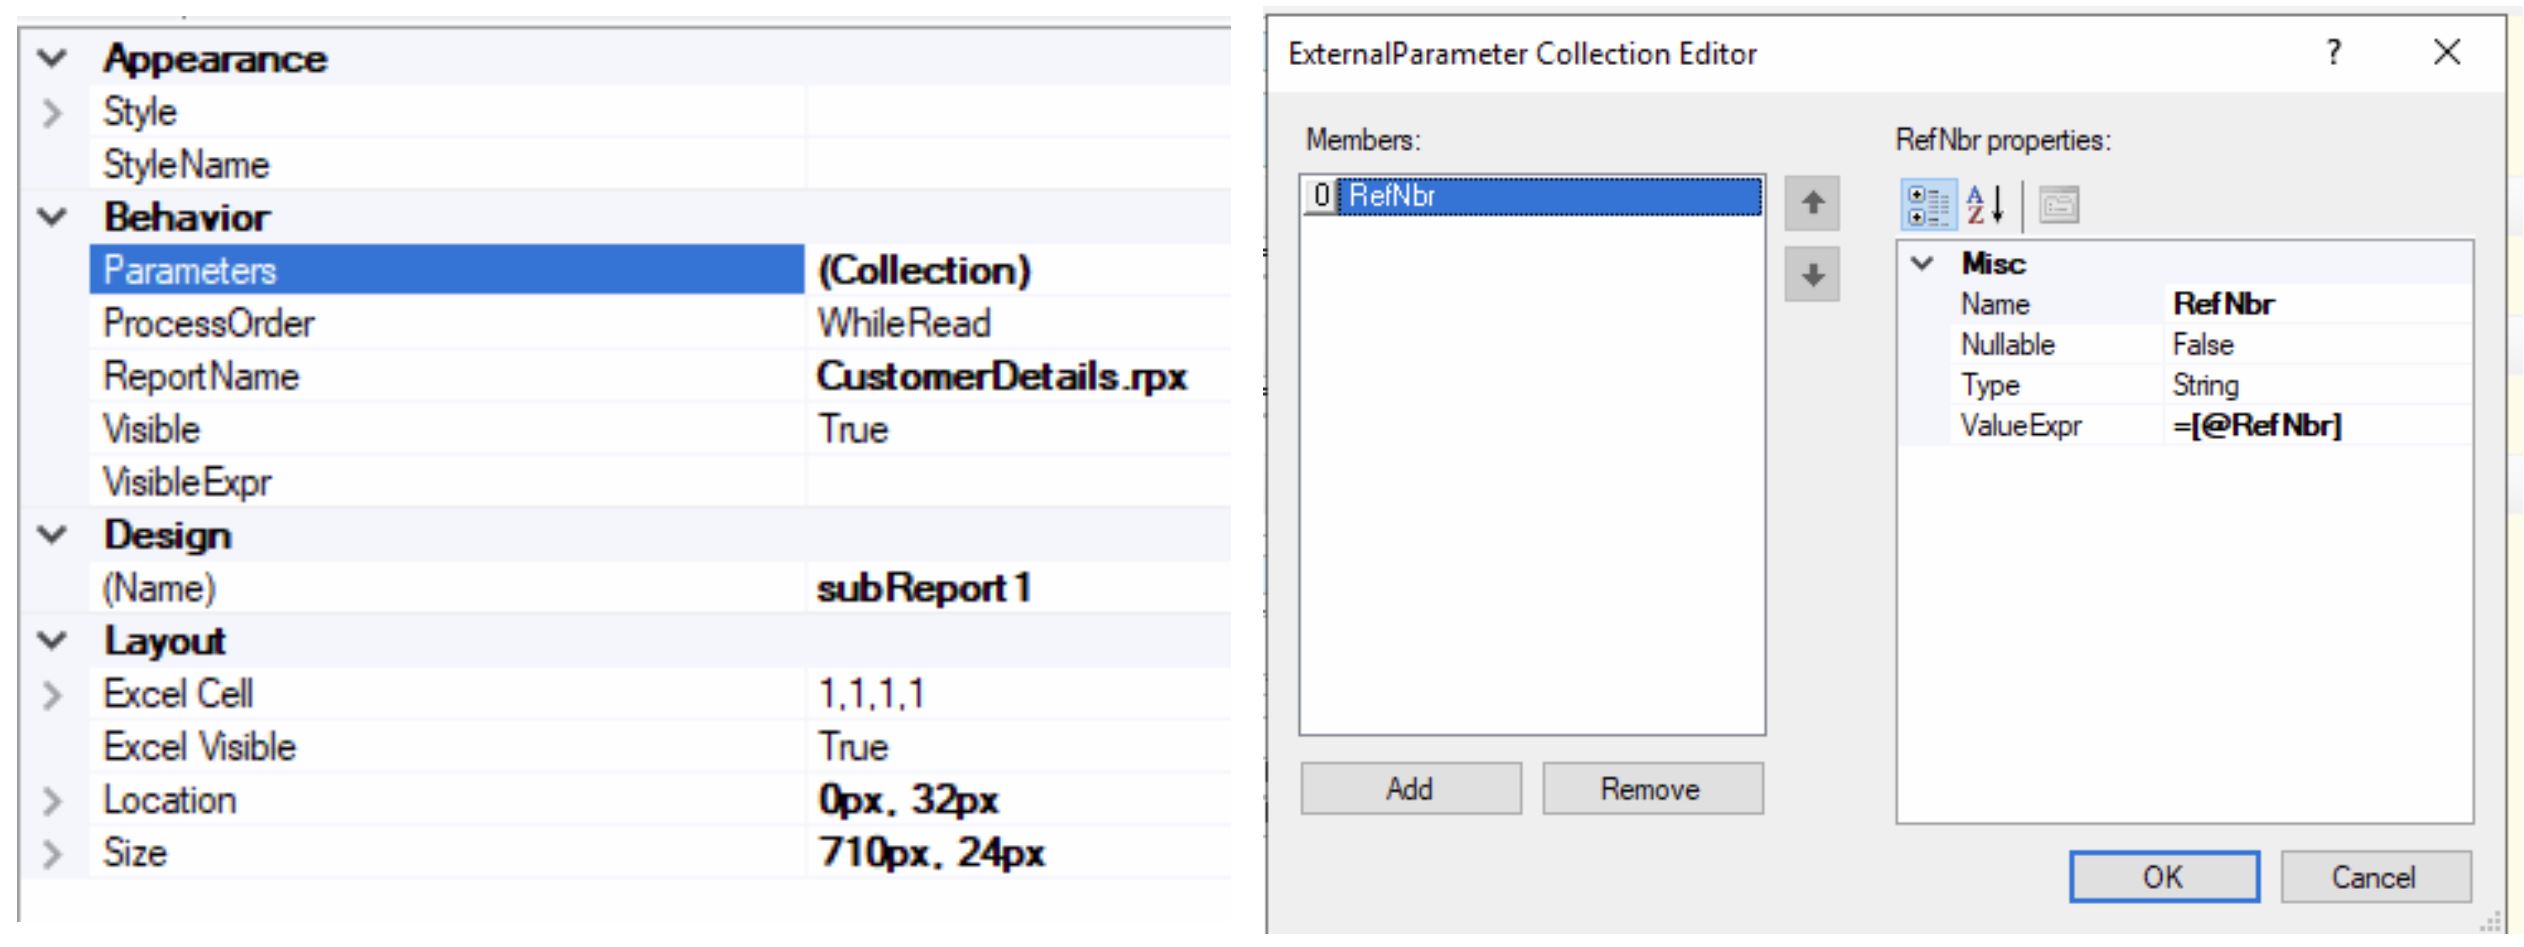
For this object, it is important to set the relevant properties, such as:
- Report Name: The name of the report that it was saved to the server with.
- Size: The size of the report, so all the columns would be visible.
- Parameters: The parameters defined in the subreport need to be provided when called from the main report

The Acumatica Report Designer is a powerful tool that allows users to create and customize reports in the Acumatica cloud ERP (Enterprise Resource Planning)system. By using built-in calculation functions and subreports, users can create more advanced and sophisticated reports that meet the needs of their business. Whether you’re a new or experienced user of the Acumatica Report Designer, these tips/tricks can help you get the most out of the tool.
Happy Reporting!
 Canada (English)
 Colombia
 Caribbean and Puerto Rico
 Ecuador
 India
India
 Indonesia
 Ireland
 Malaysia
 Mexico
 Panama
 Peru
Peru
 Philippines
 Singapore
 South Africa
 Sri Lanka
 Thailand
 United Kingdom
 United States


