 Canada (English)
 Colombia
 Caribbean and Puerto Rico
 Ecuador
 India
India
 Indonesia
 Ireland
 Malaysia
 Mexico
 Panama
 Peru
Peru
 Philippines
 Singapore
 South Africa
 Sri Lanka
 Thailand
 United Kingdom
 United States

Some of the greatest aspects of Acumatica Summit, the company’s annual showcase of cloud ERP innovation, are the informative and immersive Breakout Sessions led by product experts and partners. I had the privilege of leading a session titled Data and Reporting: Dashboards, Anomaly Detection, and Reporting in Acumatica alongside my Algorithm colleague Danielle Peterson (Senior Application Consultant) and Stephen Hennelly (Senior Acumatica Consulting Manager, Blytheco).
In the session, we reviewed Acumatica’s reporting toolkit and then dove into data refinement techniques using Generic Inquiries, Anomaly Detection, lead-time tracking, labor metrics, and manufacturing-specific dashboards. Today, I’ll present our session content in blog form, so you can take your own deep dive into Acumatica’s powerful reporting and data refinement capabilities and learn what they can do for your business.
Reporting in Acumatica
Acumatica delivers a comprehensive reporting toolkit that gives stakeholders visibility into real-time business performance. The system emphasizes a “single version of the truth” via multi-dimensional, role-based reporting and dashboards. Examples of these include:
- Prebuilt Reports: Every Acumatica application (Financials, Distribution, Manufacturing, etc.) comes with essential reports out of the box (e.g., General Ledger, AP/AR reports, inventory analysis). These deliver real-time data without users having to write code.
- Custom Reports and Dashboards: Users can quickly modify existing reports or design new ones to fit their needs via the Report Designer (more on this below). Dashboards support a variety of widgets (charts, KPIs, grids, and pivot tables) that display filtered views of GI results, ensuring everyone has access to the same accurate underlying data. This access to reports and dashboards is controlled by user roles, so each person sees only the data they are authorized to view.
- Flexible Display: Reports and dashboards can be viewed on-screen, printed, or exported to Excel/PDF, and dashboards adapt to different devices for mobile/desktop views.
Taken together, these features let companies monitor key metrics and spot trends quickly.
Acumatica Report Designer
For highly formatted reports, Acumatica provides the Report Designer, a separate local Windows application that opens Acumatica’s database in a design interface. Users can add data fields, define parameters, and lay out pages exactly as needed. For example, the Report Designer lets you define input parameters or filters to limit data (e.g., select a specific customer or date range), specify grouping and sort order, and incorporate formulas or sub-reports.
In short, when Acumatica’s built-in reports don’t fully meet your needs, the Report Designer enables you to create printable reports with complete control over formatting. Reports can include charts, barcodes, and calculated fields and can be saved to the ERP solution or exported externally.
Reports are great for static snapshots and official outputs, but what if you need interactive “slice-and-dice” analysis?
That’s where Generic Inquiries come in.
Data Refining with Generic Inquiries
Generic Inquiries (GIs) in Acumatica are user-friendly query builders that extract and present live data from the ERP database. A GI is essentially an easy-to-use SQL-based query where you define which tables and fields to join and how to filter and sort the results.
You can think of a GI as asking Acumatica a question (e.g., “Show me all inventory items below safety stock”) and getting back a data grid as the answer. Because GIs use the underlying SQL tables but have a no-code interface, even non-developers can build powerful queries. Out of the box, Acumatica provides standard GI templates (e.g., find all customers, find all sales orders), and you can extend these or create new inquiries to pull exactly the information you need every time.
Key benefits of Generic Inquiries include:
- Custom Dashboards and Reports: GIs can feed dashboard widgets and pivot tables. For example, you can build a GI that computes key performance indicators (KPIs) and then display those KPIs on a real-time dashboard.
- Drill-Down Analysis: Query results can be grouped, sorted, and filtered on the fly, and you can drill into any record. For instance, a GI can list sales orders, and clicking on an order number can open the order details.
- Quick Ad-Hoc Queries: Need a one-off report? GIs let you pull data on the fly. For example, generate a list of open invoices over a certain threshold or a list of customers in a certain region without writing SQL.
- Data Health and Alerts: Generic inquiries can help identify data discrepancies (e.g., missing addresses, negative inventory) or feed into Anomaly Detection. They can also be used to trigger Business Events, like sending alerts when a GI finds an overdue obligation.
By giving business users direct access to query their data, GIs turn raw tables into refined, actionable information. The built-in Acumatica GI interface (screen SM208000) lets you select tables and specify joins, choose which fields appear on the Results Grid, and set conditions and parameters for filtering. Any GI can be saved, shared, and reused.
Anomaly Detection: Strategies for Data Refinement
When designing Gis for anomaly detection, it’s helpful to consider how they will be used operationally. Two common approaches to using GIs in business management are Manage by Exception and Manage by Routine:
- Manage by Exception: Focus on outliers or anomalies that need immediate attention. For example, set up GIs to highlight production variances automatically (like labor hours exceeding estimates or machine downtime beyond thresholds), supply chain issues (like vendors delivering late or with high cost variances), or data quality exceptions (like missing critical data or quality control issues). By filtering for these exception conditions, managers can quickly spot and correct problems.
- Manage by Routine: Guarantee that routine processes stay on track by monitoring baseline metrics. Examples include a GI that tracks average lead times on purchase orders or production cycles, daily labor hour totals by employee, or routine inventory levels. Ensuring these numbers remain within normal ranges provides confidence in the data and processes.
Using GIs in both modes means you can both proactively catch issues (exceptions) and ensure healthy data flows (routines).
Using Generic Inquiries in Dashboards
Generic Inquiries serve as the data engine for dashboards in Acumatica. By leveraging GI filters and drill-down capabilities, dashboards become highly interactive and tightly coupled with live ERP data. Once created, GIs can power dashboard widgets.
In Acumatica, a dashboard widget will usually source its data from any GI (by selecting the GI widget type). When you add such a widget, you choose the GI screen (SM208000) and specify which inquiry and fields to display. The GI’s filters can be used to limit the dashboard data. For example, you can mark a GI filter as Shared so that setting a filter value (say a date range or a specific vendor) affects all related widgets on the dashboard.
Users can also add widgets that display the number of anomalies found by a GI and clicking such a widget drills into the GI list of exception records. In practice, you might put a labor performance metrics GI into a dashboard and filter by work center or week, or you could put a vendor performance GI in a chart widget that filters vendors by region. Under the hood, the dashboard widget simply runs the GI with the given filters.
Putting It All Together
In summary, Acumatica offers a spectrum of data and reporting tools. Standard reports and the Report Designer provide formatted outputs on demand. Generic Inquiries give users the power to refine and slice ERP data for deeper insight. And new AI-powered functionalities, like Anomaly Detection, leverage those GIs to flag outliers automatically.
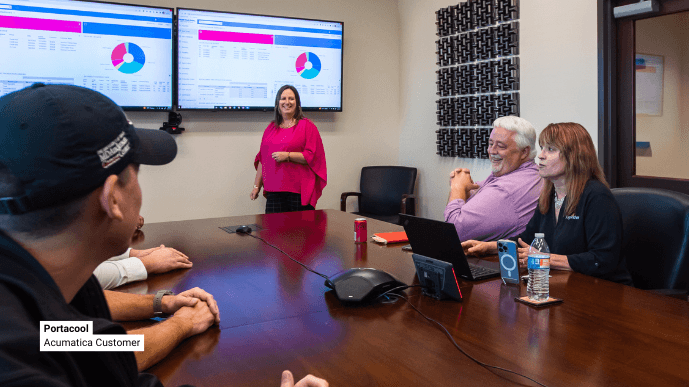
By combining these features, organizations gain actionable visibility into data entities such as lead times, labor usage, vendor metrics and more, enabling both exception-driven management and routine performance tracking. One organization that’s greatly benefited from Acumatica’s advanced data and reporting capabilities is Portacool, an industry leader in evaporative cooling.
Portacool struggled to operate on a legacy ERP and multiple spreadsheets. This unfortunate combination meant the business had to deal with data silos, limited data visibility, manual processes (including manual inventory counts and typing financial statement data into a separate reporting package on a monthly basis), and no dashboards. It was no way to run a business, so they implemented Acumatica Manufacturing.
With the help of our team at Algorithm, Portacool enjoyed a rapid deployment, gaining real-time visibility, streamlined operations, and improved decision making in the process. They also reduced month-end close by 86%, cut inventory count time by 75%, and improved cash flow. Automated processes eliminated manual data entry, while personalized dashboards provided critical metrics. And Portacool has full inventory visibility and seamless connection to third-party applications.
“The only way to survive and be successful in this market is to have visibility into the KPIs to drive manufacturing, maintain profitability, drive customer satisfaction and quality. We couldn’t have done that without Acumatica,” Bill Ferren, Director of Information Technology, says.
Thanks to Acumatica and its sophisticated data and reporting capabilities, Portacool is driving growth through accurate, real-time data.
Says Kimberly McElroy, Director of Operations, “Acumatica is the pulse of our company. The visibility we have to the entire business has been the largest benefit at this point, but we have a lot more opportunities ahead as we continue to uncover and explore more of Acumatica’s functionality.”
If you too would like to explore Acumatica’s functionality, contact our team here at Algorithm. As an Acumatica partner, we’re committed to your success and look forward to ensuring your business continues to make incredible strides.
You can also contact the Acumatica team directly to learn even more about how Acumatica’s anomaly detection and other ERP AI capabilities can help transform your business.
